NEVWolf Pack–
4:15 PM ETProps coming soon · BTN
UCLABruins–
Moneyline Projection
Model: 1,000,000 simulated games from team scoring efficiency (offensive PPG vs opponent points allowed, +2.5 home field). Simplified efficiency model.
Model expected score: NEV 22.9 – UCLA 33.1
NEV defensefaces UCLA
vs QB
#20
#20 163.3 yds/gm
vs RB
#130
#130 207.3 yds/gm
vs WR
#20
#20 163.3 yds/gm
vs TE
#20
#20 163.3 yds/gm
Ranks of 138 FBS teams · #1 = toughest · red = tough, green = soft
UCLA defensefaces NEV
vs QB
#92
#92 225.8 yds/gm
vs RB
#17
#17 91.3 yds/gm
vs WR
#92
#92 225.8 yds/gm
vs TE
#92
#92 225.8 yds/gm
Ranks of 138 FBS teams · #1 = toughest · red = tough, green = soft
🏥 Injury Reportvia Covers · updated through the week
Nevada Wolf Pack
QBC. JonesUndisclosedQUES
UCLA Bruins
QBNico IamaleavaLegOUT
WRMikey MatthewsUndisclosedOUT
OGJordan DavisUndisclosedOUT
CBRodrick PleasantUndisclosedOUT
TEJosh PhiferUndisclosedQUES
OGS. YoonUndisclosedQUES
Player Board
Tap a player to expand

Ty Dieffenbach
UCLA · 3 props
Pass Yds
Line 215.5 · Avg 43.0 · L5 0/1
O -123 U -126
Rush Yds
Line 11.5 · Avg -15.0 · L5 0/1
O -115 U -115
Anytime TD
Line Yes · Avg 0.0 · L5 0/1
O +190 U -189
AJ Bianco
NEV · 1 props
Anytime TD
Line Yes · Avg 0.5 · L5 2/4
O +100 U -
Luke Duncan
NEV · 1 props
Anytime TD
Line Yes · Avg 0.0 · L5 0/3
O +100 U -
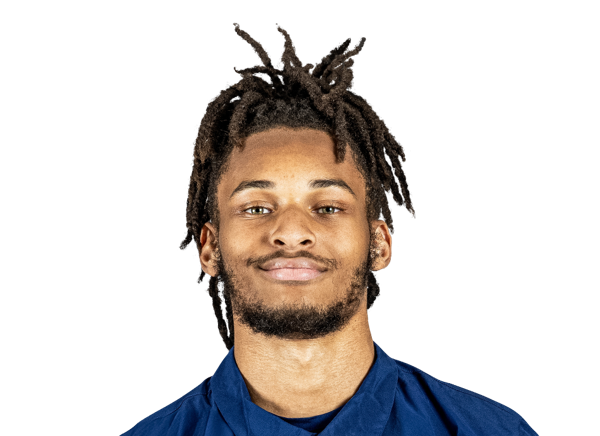
Carter Jones
NEV · 1 props
QUESAnytime TD
Line Yes · Avg 0.2 · L5 1/4
O +100 U -
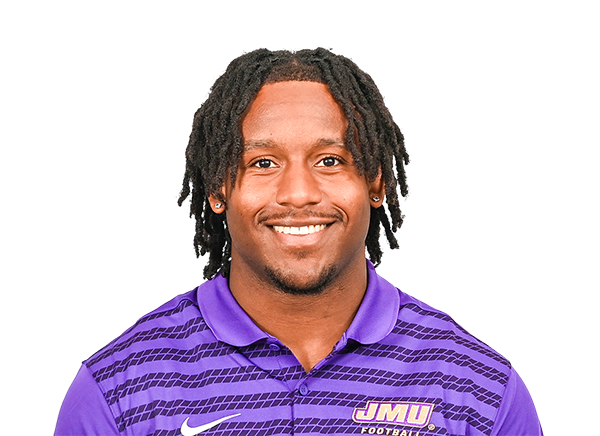
Wayne Knight
UCLA · 4 props
Rush Yds
Line 87.5 · Avg 109.6 · L5 4/5
O -115 U -115
Rec Yds
Line 9.5 · Avg 25.0 · L5 4/4
O +105 U -103
Receptions
Line 1.5 · Avg 2.8 · L5 4/4
O +100 U -135
Anytime TD
Line Yes · Avg 2.2 · L5 5/5
O -222 U +225

Dominic Kelley
NEV · 4 props
Rush Yds
Line 47.5 · Avg 83.1 · L5 4/5
O - U -
Rec Yds
Line 13.5 · Avg 20.2 · L5 4/5
O -115 U -115
Receptions
Line 2.5 · Avg 2.3 · L5 2/5
O -120 U -110
Anytime TD
Line Yes · Avg 0.9 · L5 3/5
O +224 U -222
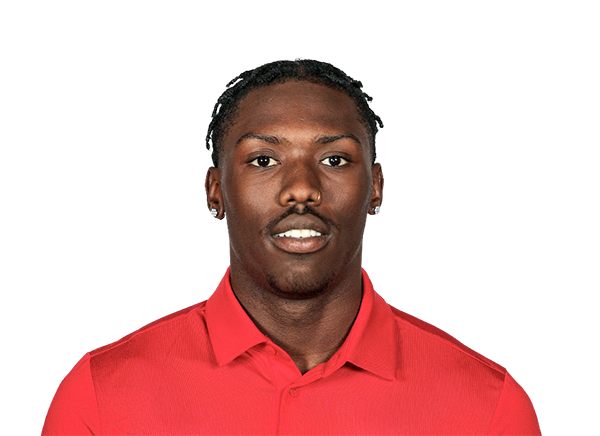
Anthony Woods
UCLA · 2 props
Rush Yds
Line 59.5 · Avg 61.6 · L5 2/5
O -115 U -115
Anytime TD
Line Yes · Avg 0.8 · L5 3/5
O -115 U +116

Herschel Turner
NEV · 2 props
Rush Yds
Line 34.5 · Avg 68.6 · L5 3/5
O - U -
Anytime TD
Line Yes · Avg 0.7 · L5 3/5
O +532 U -526
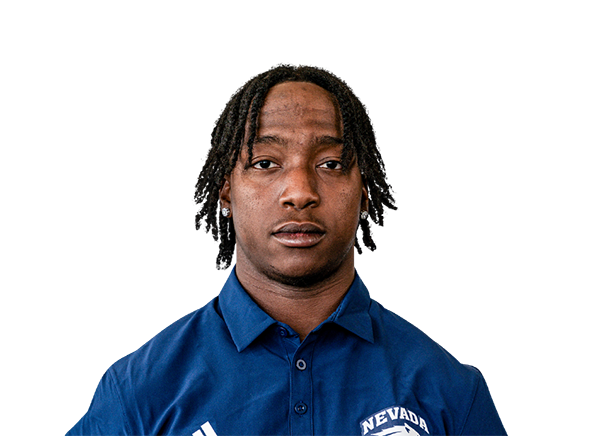
Ky Woods
NEV · 1 props
Anytime TD
Line Yes · Avg 0.0 · L5 0/5
O +100 U -
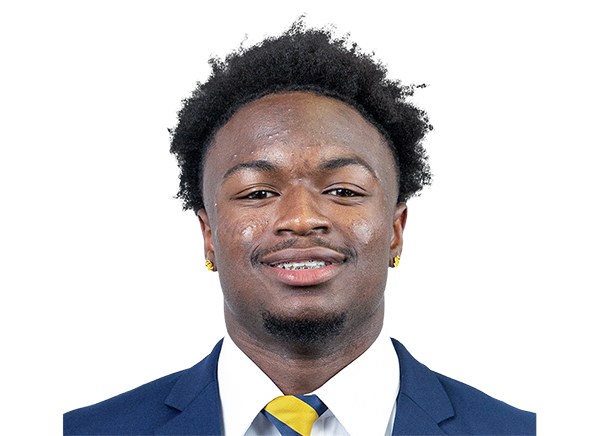
Jaivian Thomas
UCLA · 1 props
Anytime TD
Line Yes · Avg 0.6 · L5 3/5
O +157 U -154

Semaj Morgan
UCLA · 3 props
Rec Yds
Line 53 · Avg 45.8 · L5 3/5
O - U -
Receptions
Line 4.5 · Avg 3.8 · L5 2/5
O -115 U -115
Anytime TD
Line Yes · Avg 0.4 · L5 1/5
O +225 U -222
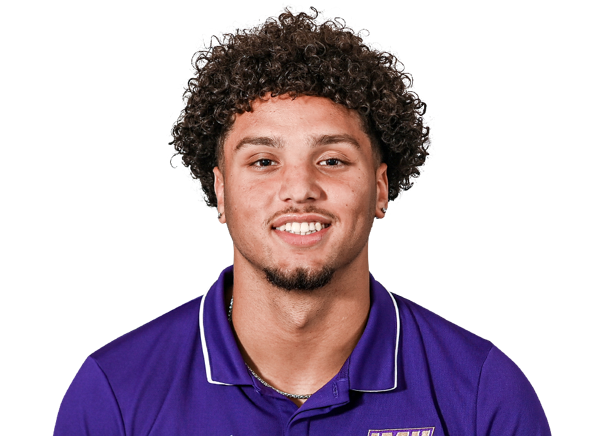
Landon Ellis
UCLA · 3 props
Rec Yds
Line 25.5 · Avg 22.7 · L5 1/3
O -115 U -115
Receptions
Line 2.5 · Avg 1.7 · L5 1/3
O +125 U -170
Anytime TD
Line Yes · Avg 0.3 · L5 1/3
O +505 U -500
Hit rates are last-5 games vs the listed line. Lines move - check your book. Max 1.5u - bet responsibly.
How to read edges: the % is the model's probability for the side it favors - green = over, red = under. Stars = model confidence (Kelly-based), not a betting recommendation. Max 1.5u - bet responsibly.